




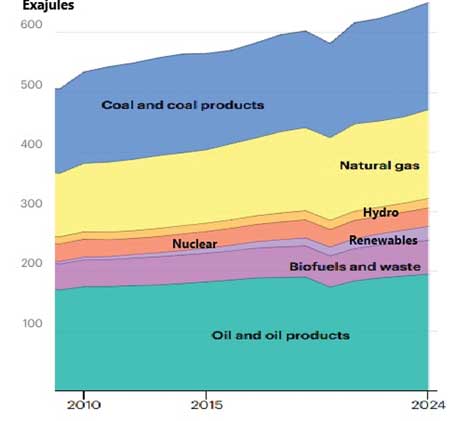
 Available data indicates the continuously rising trend of energy consumption by humans. The energy demand growth is partly because of consumption increase and partly because of population growth. The trend for both has been upward so far and will be the same for many years to come. Figure 1 exemplifies the trend, based on the data which is available from 1800 to today [1].
By Ahmad Hemami, McGill University, Montreal, Canada
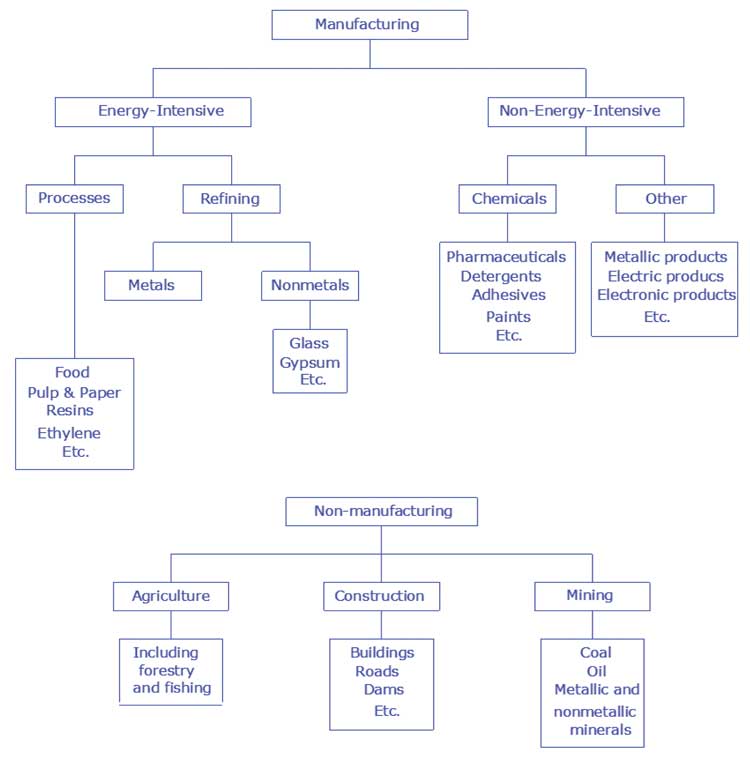
Primarily, energy is for domestic consumption (heating, cooling, cooking, lighting) or for industrial applications and transport. The same applies to electrical energy, which is a portion of primary energy. In general, the domestic consumption is smaller; for instance, for electrical energy the domestic portion is about 27% [2] and the rest (73%) is for commercial, industry applications and transportation. The share of transportation is very low but is increasing because of electric vehicles. Various categories of industrial energy consumption, based on categorisation by IEA (International Energy Agency) [3] is depicted in Figure 2.
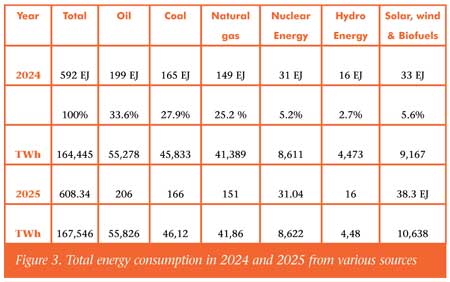
The numbers for total global energy consumption in 2024 sum up to 592 EJ (Exa Jules = 1018 Jules). Together with 2025 numbers, the shares for various sources where this energy comes from is illustrated in Figure 3.
 Global warming, a man-caused phenomenon, is also responsible for the increase in energy demand. In addition to devastating effects such as increasing tornados and wildfires and destructive actions in the form of heavy rainfalls and floods, it causes a demand for more energy towards cooling buildings and for rebuilding the destroyed or damaged roads, buildings and so on. Some lunatics deny global warming, although the evidence is very present and can be observed all over the world.
As shown in Figure 1 and Figure 3, fossil fuels account for about 86% of the total global energy supply in 2025. Variation from year to year around this number is marginal, although the wind and solar grew about 16% in the most recent year, but their share is about %3 only.
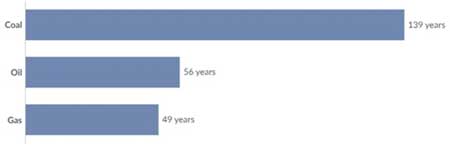 The chart depicted in Figure 4 depicts the remaining number of years for reserves of gas, oil and coal from 2020, based on the world current consumption rate of various types of energy. This chart shows that these sources of energy will come to an end some time in the future.
By the time these reserves come to an end, the population (and the energy consumption) has increased too. It is wise to act for the replacement from now.
Further reading
[1] Our world in data: https://ourworldindata.org/energy
[2] The Energy Institute: www.energyinst.org/statistical-review/resources-and-data-downloads
[3] International Energy Agency: www.iea.org/reports/global-energy-review-2026/electricity-demand